Thermistor Testing Process
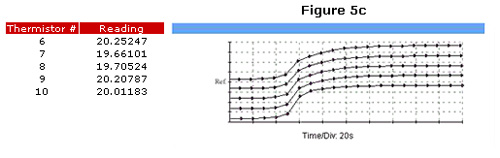
In Figures 5a, 5b and 5c, 10 thermistors were plotted while also plotting the temperature of the bath used to test them. Additionally, the temperature of the fixture used to transport the 10 test thermistors from bath to bath was measured.
Figure 5a shows the 25°C bath in purple, the 70°C bath in red and the device transporting the thermistors under test is plotted in green. We can see the temperature of the fixture starting off at equilibrium at 70°C, watch as it drops in temperature to 25°C, and be assured that it is at equilibrium at 25°C before recording the thermistor readings.
Figure 5a
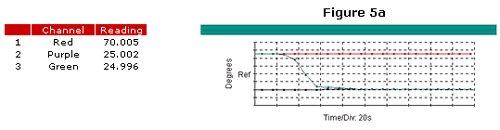
Figures 5b and 5c show the resistance values of the ten thermistors under test as well as the actual readings. Any portion of these graphs can be combined to a single plot and we still have the ability to roll back time and zoom in on any of the measurements taken. The ADC system is capable of measuring Temperature, Resistance, Voltage, Current, and Frequency.
Figure 5b
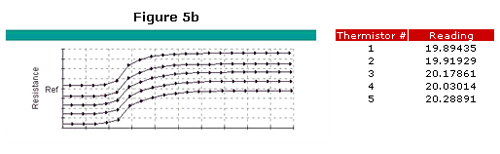
Figure 5c